
Every life runs on the real world
A life in Mediocre Life Story isn't written by hand. It's drawn, year by year, from a world database of 3.7 million rows and 3,298 sources, covering 224 countries from 1930 to today.
How one life is built
A life is a seed, a birthplace and your decisions. Everything else comes from the data.
You're born where people were really born
The birth lottery weighs every country and year by its real number of births, so you're far more likely to be born in India or Nigeria than in Iceland, just like real babies. (By default most lives start between 1980 and 2007, the years most players relate to; a setting switches to pure history.) At birth the game compares your circumstances (income, lifespan, schooling, safety, freedom, passport) with every baby born that year and tells you how privileged you were.
Every year has real odds of ending
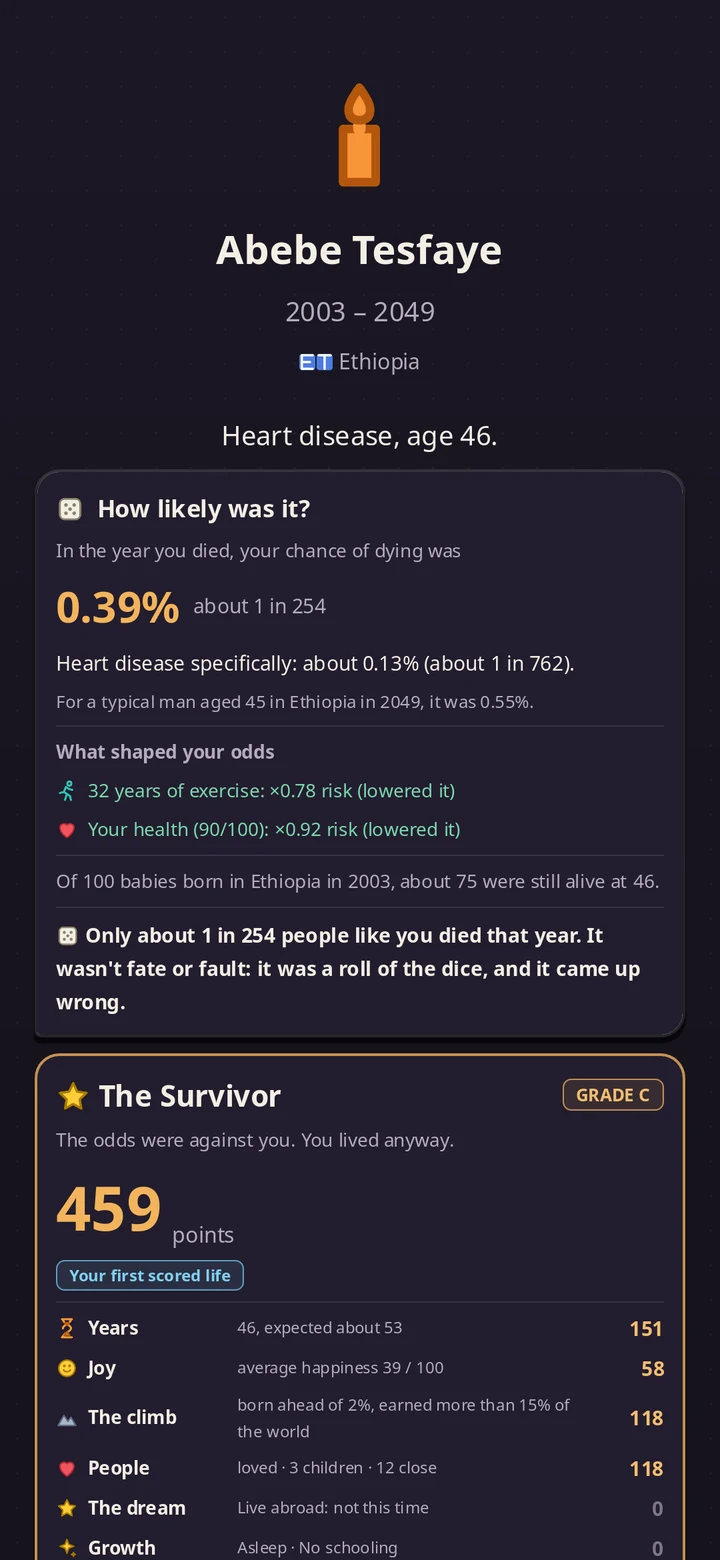
Your chance of dying each year comes from life tables for your country, year, sex and age, with 140 causes of death by age and sex. Your own life shifts those odds with effect sizes from published research (smoking, exercise, drinking, your health, dangerous jobs). When a life ends, the game shows how likely that death was, what shaped the odds, and how many of 100 babies born with you were still alive at that age.
History happens to you
300 conflicts from 1930 to 2026 are modelled month by month, down to the regions where fighting was worst. Living through one brings real risks of death and injury (civilians are wounded about three times as often as they're killed). Famines, pandemics, disasters, coups, changing borders and new laws arrive in the year they really did.
Money, work and moving
Incomes follow the real income distribution of 239 economies over time. 301 occupations carry their wages relative to the national median and their real fatality rates. If you want to leave, a 199 × 199 visa matrix, passport strength since 1973, asylum outcomes and irregular routes with their real death rates decide how hard it is.
Love and family follow the culture
When people marry follows the local average age at first marriage for your sex, country and era; how many ever marry follows census never-married rates. Where families arrange matches, courtship leads to marriage; where people date, they move in, sometimes break up, and marry later. Family structure is generated per country and birth decade across 18 dimensions.
What you can know
Access to radio, TV, computers and the internet follows each country's real adoption curve since 1930. 294 real influencers, press freedom, religiosity and schooling shape your beliefs, and the game's consciousness system decides how much of your own life's machinery you can see.
Nine areas of life
| Area | Rows | What's in it |
|---|---|---|
| 🌍 Countries | ~55k | 251 entities and 12 historical states (USSR, Yugoslavia, East Germany…), 54 indicators 1930–2025, sovereignty timeline, colonial periods, religion, languages |
| ❤️ Health | ~650k | Life tables for 237 countries 1930–2023, 140 causes of death by age and sex, 229 diseases, 293 risk-factor effect sizes, epidemics |
| ⚔️ Conflict | ~63k | 300 conflicts 1930–2026 with monthly death hazards by country and sub-region, atrocities, famines, disasters, conscription, escape routes |
| 👪 Family | ~270k | Family structure by country and birth decade, marriage and divorce, living arrangements, parental death, relationships |
| 💰 Economy | ~335k | Income percentiles for 239 economies, wealth, mobility, 301 occupations, crises, inflation |
| 🧳 Migration | ~800k | Visa matrix 199 × 199, passport strength since 1973, migrant stocks, asylum outcomes, irregular routes and their death rates |
| 📡 Influence | ~410k | 294 real influencers, media access 1930–2025, children's computer access, religiosity, olympiad results, press freedom |
| 🏃 Behaviour | ~740k | Substance use, height by birth cohort 1896–2000, personality for 74 countries, habit effect sizes, happiness, time use |
| ⚖️ Law | ~210k | Homicide since 1900, incarceration, governance since 1900, the legal status of 43 behaviours by country and year |
Main sources include the UN Population Division (World Population Prospects), the World Bank, the World Health Organization, the Human Mortality Database, UNICEF, UNHCR, the ILO, UNESCO, the OECD, Our World in Data, the Uppsala Conflict Data Program, V-Dem, the World Inequality Database, Gallup, Freedom House and Reporters Without Borders, plus hundreds of peer-reviewed studies. The full list is on the credits page.
When the data runs out
No database has every number for every country in every year. Rather than invent one, the game walks outward until something real answers:
- The same country in the nearest years (interpolated, or carried forward a limited time)
- A broader category (women and men combined, a related income measure)
- The state it belonged to that year (Ukraine in 1950 → the USSR), never a colonial ruler
- Successor or predecessor states, weighted by population
- The most similar countries that decade, by income, lifespan, child mortality, fertility, cities and schooling
- Regional averages, then income group, then the world
Every answer carries a confidence score and a trace of how it was found, for example: “Eritrea: no data › similar countries › from Rwanda, Comoros, Madagascar, Malawi, Tanzania.”
After 2026: the edge of history
Everything up to the present really happened. The 2023–2026 gap was filled source by source, and every filled value is logged with how it was obtained: an observed release, an official projection, a nowcast, a news event or an extrapolation.
When a life crosses into the future, the game says so. From there, mortality keeps falling slowly, incomes grow slowly, and wars and pandemics arrive at their historical base rates. The screen fogs over, because nobody knows.
Checked against reality
The game is tested by simulating thousands of lives and comparing the results with the real world. For example, the share of simulated people married by 45, by culture, against census data:
| Culture group | Simulated | Census data | Median age at first marriage (simulated · data) |
|---|---|---|---|
| West & South Asia | 100% | 98% | 23 · 23.6 |
| African-Islamic | 99% | 97% | 23 · 24.4 |
| Confucian | 99% | 97% | 25 · 25.9 |
| English-speaking | 86% | 87% | 29 · 26.7 |
| Catholic Europe | 86% | 84% | 29 · 29.2 |
| Latin America | 95% | 87% | 26 · 25.1 |
From the game's own test suite (a few hundred simulated lives per group, so small groups vary from run to run). Saved games and “what if” replays are also tested to reproduce lives exactly.
What the game is not
Mediocre Life Story is a game built on statistics. It shows the odds that people like you faced; it cannot know your life, and it simplifies a great deal. Many numbers are modelled estimates, and each one carries a confidence label in the database. Nothing in it is medical, financial, legal or immigration advice.
Spotted a number that looks wrong? Tell us through Support. Every row can be traced to its source.